Broadband FCC Mapping
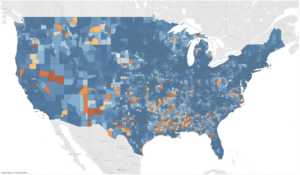
Figure 1: The FCC Form 477 Broadband Data across the continuous United States for year 2020. Dark blue color represents the highest percentage (100 percent) coverage of broadband internet speeds (≥ 25 Mbps in download speed). Dark Orange color represents the lowest percentage (0 percent) coverage of broadband internet speeds. Here is the link to the live map:
https://public.tableau.com/app/profile/institute.of.digital.health.innovation/viz/FCCBroadbandMap/FCCBroadband

Figure 2: The FCC Form 477 Broadband Data restricted to the state of Texas for the year 2020. Dark blue color represents the highest percentage (100 percent) coverage of broadband internet speeds (≥ 25 Mbps in download speed). Dark Orange color represents the lowest percentage (0 percent) coverage of broadband internet speeds.
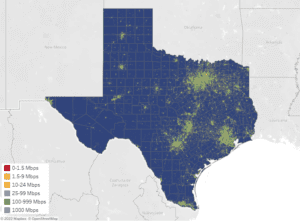
Figure 3: Ookla for Good Internet Speed Tiles for the state of Texas during Q4 (Oct, Nov, Dec) of 2021. These data show internet download speeds for both fixed and mobile data. Colors represent internet speed bins and are as follows: 0-1.5 Mbps (red), 1.5-9 Mbps (orange), 10-24 Mbps (yellow), 25-99 Mbps (light blue), 100-999 Mbps (green), and 1000 Mbps (purple). Here is a link to the live map:
https://public.tableau.com/app/profile/institute.of.digital.health.innovation/viz/OoklaforGoodTexasInternetSpeedsMap/OoklaTiles.
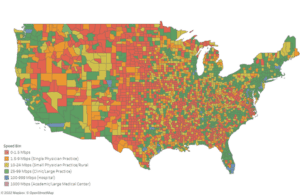
Figure 4: M-Lab Internet Speeds across the continental United States averaged at the county level for year 2021. Colors represent internet speed bins and are as follows: 0-1.5 Mbps (red), 1.5-9 Mbps (orange), 10-24 Mbps (yellow), 25-99 Mbps (light blue), 100-999 Mbps (green), and 1000 Mbps (purple). Here is the live map link:
https://public.tableau.com/app/profile/institute.of.digital.health.innovation/viz/M-LabInternetSpeedsMap/us_dash.
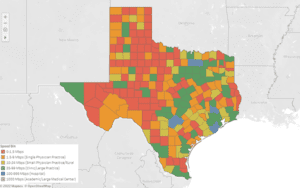
Figure 5: M-Lab Internet Speeds for the state of Texas averaged at the county level for year 2021. Colors represent internet speed bins and are as follows: 0-1.5 Mbps (red), 1.5-9 Mbps (orange), 10-24 Mbps (yellow), 25-99 Mbps (light blue), 100-999 Mbps (green), and 1000 Mbps (purple).

Figure 6: USAC Internet Speeds for the state of Texas for year 2014. Dots represent download speeds for HCF and Telecom filing entities. Colors represent internet speed bins and are as follows: 0-1.5 Mbps (red), 1.5-9 Mbps (orange), 10-24 Mbps (yellow), 25-99 Mbps (light blue), 100-999 Mbps (green), and 1000 Mbps (purple).
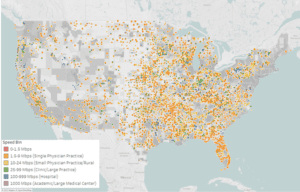
Figure 7: USAC Internet Speeds for the continental United States for year 2014. Dots represent download speeds for HCF and Telecom filing entities. Colors represent internet speed bins and are as follows: 0-1.5 Mbps (red), 1.5-9 Mbps (orange), 10-24 Mbps (yellow), 25-99 Mbps (light blue), 100-999 Mbps (green), and 1000 Mbps (purple). Here is the live map link:
https://public.tableau.com/app/profile/institute.of.digital.health.innovation/viz/USACInternetSpeedMap/speed_dash.
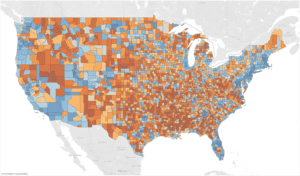
Figure 8: Microsoft Broadband Data across the continental United States for year 2020. Dark blue color represents the highest percentage (100 percent) coverage of broadband internet speeds (≥ 25 Mbps). Dark Orange color represents the lowest percentage (0 percent) coverage of broadband internet speeds.
https://public.tableau.com/app/profile/institute.of.digital.health.innovation/viz/MicrosoftBroadbandMap/MicrosoftBroadband.
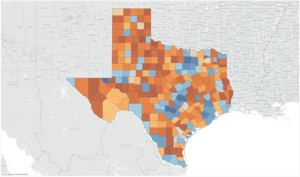
Figure 9: Microsoft Broadband Data restricted to the state of Texas for the year 2020. Dark blue color represents the highest percentage (100 percent) coverage of broadband internet speeds (≥ 25 Mbps). Dark Orange color represents the lowest percentage (0 percent) coverage of broadband internet speeds.
